 Desktop
Desktop
Desktop Desktop
Desktop
Desktop
Business Intelligence tools are designed to make sense of the huge quantities of data that organizations accumulate over time. BI tools analyze this information and present it as actionable information that can guide decision making.
Data Visualization products have a different purpose. These BI tools are primarily designed to help data analysts discover patterns in large quantities of data and to build compelling visual representations which allow these patterns to be easily understood.
We engaged the global analytics communities in the planning process for a future Enterprise Analytics Platform to aggregate the range of data sources into a single source of truth for the organization.
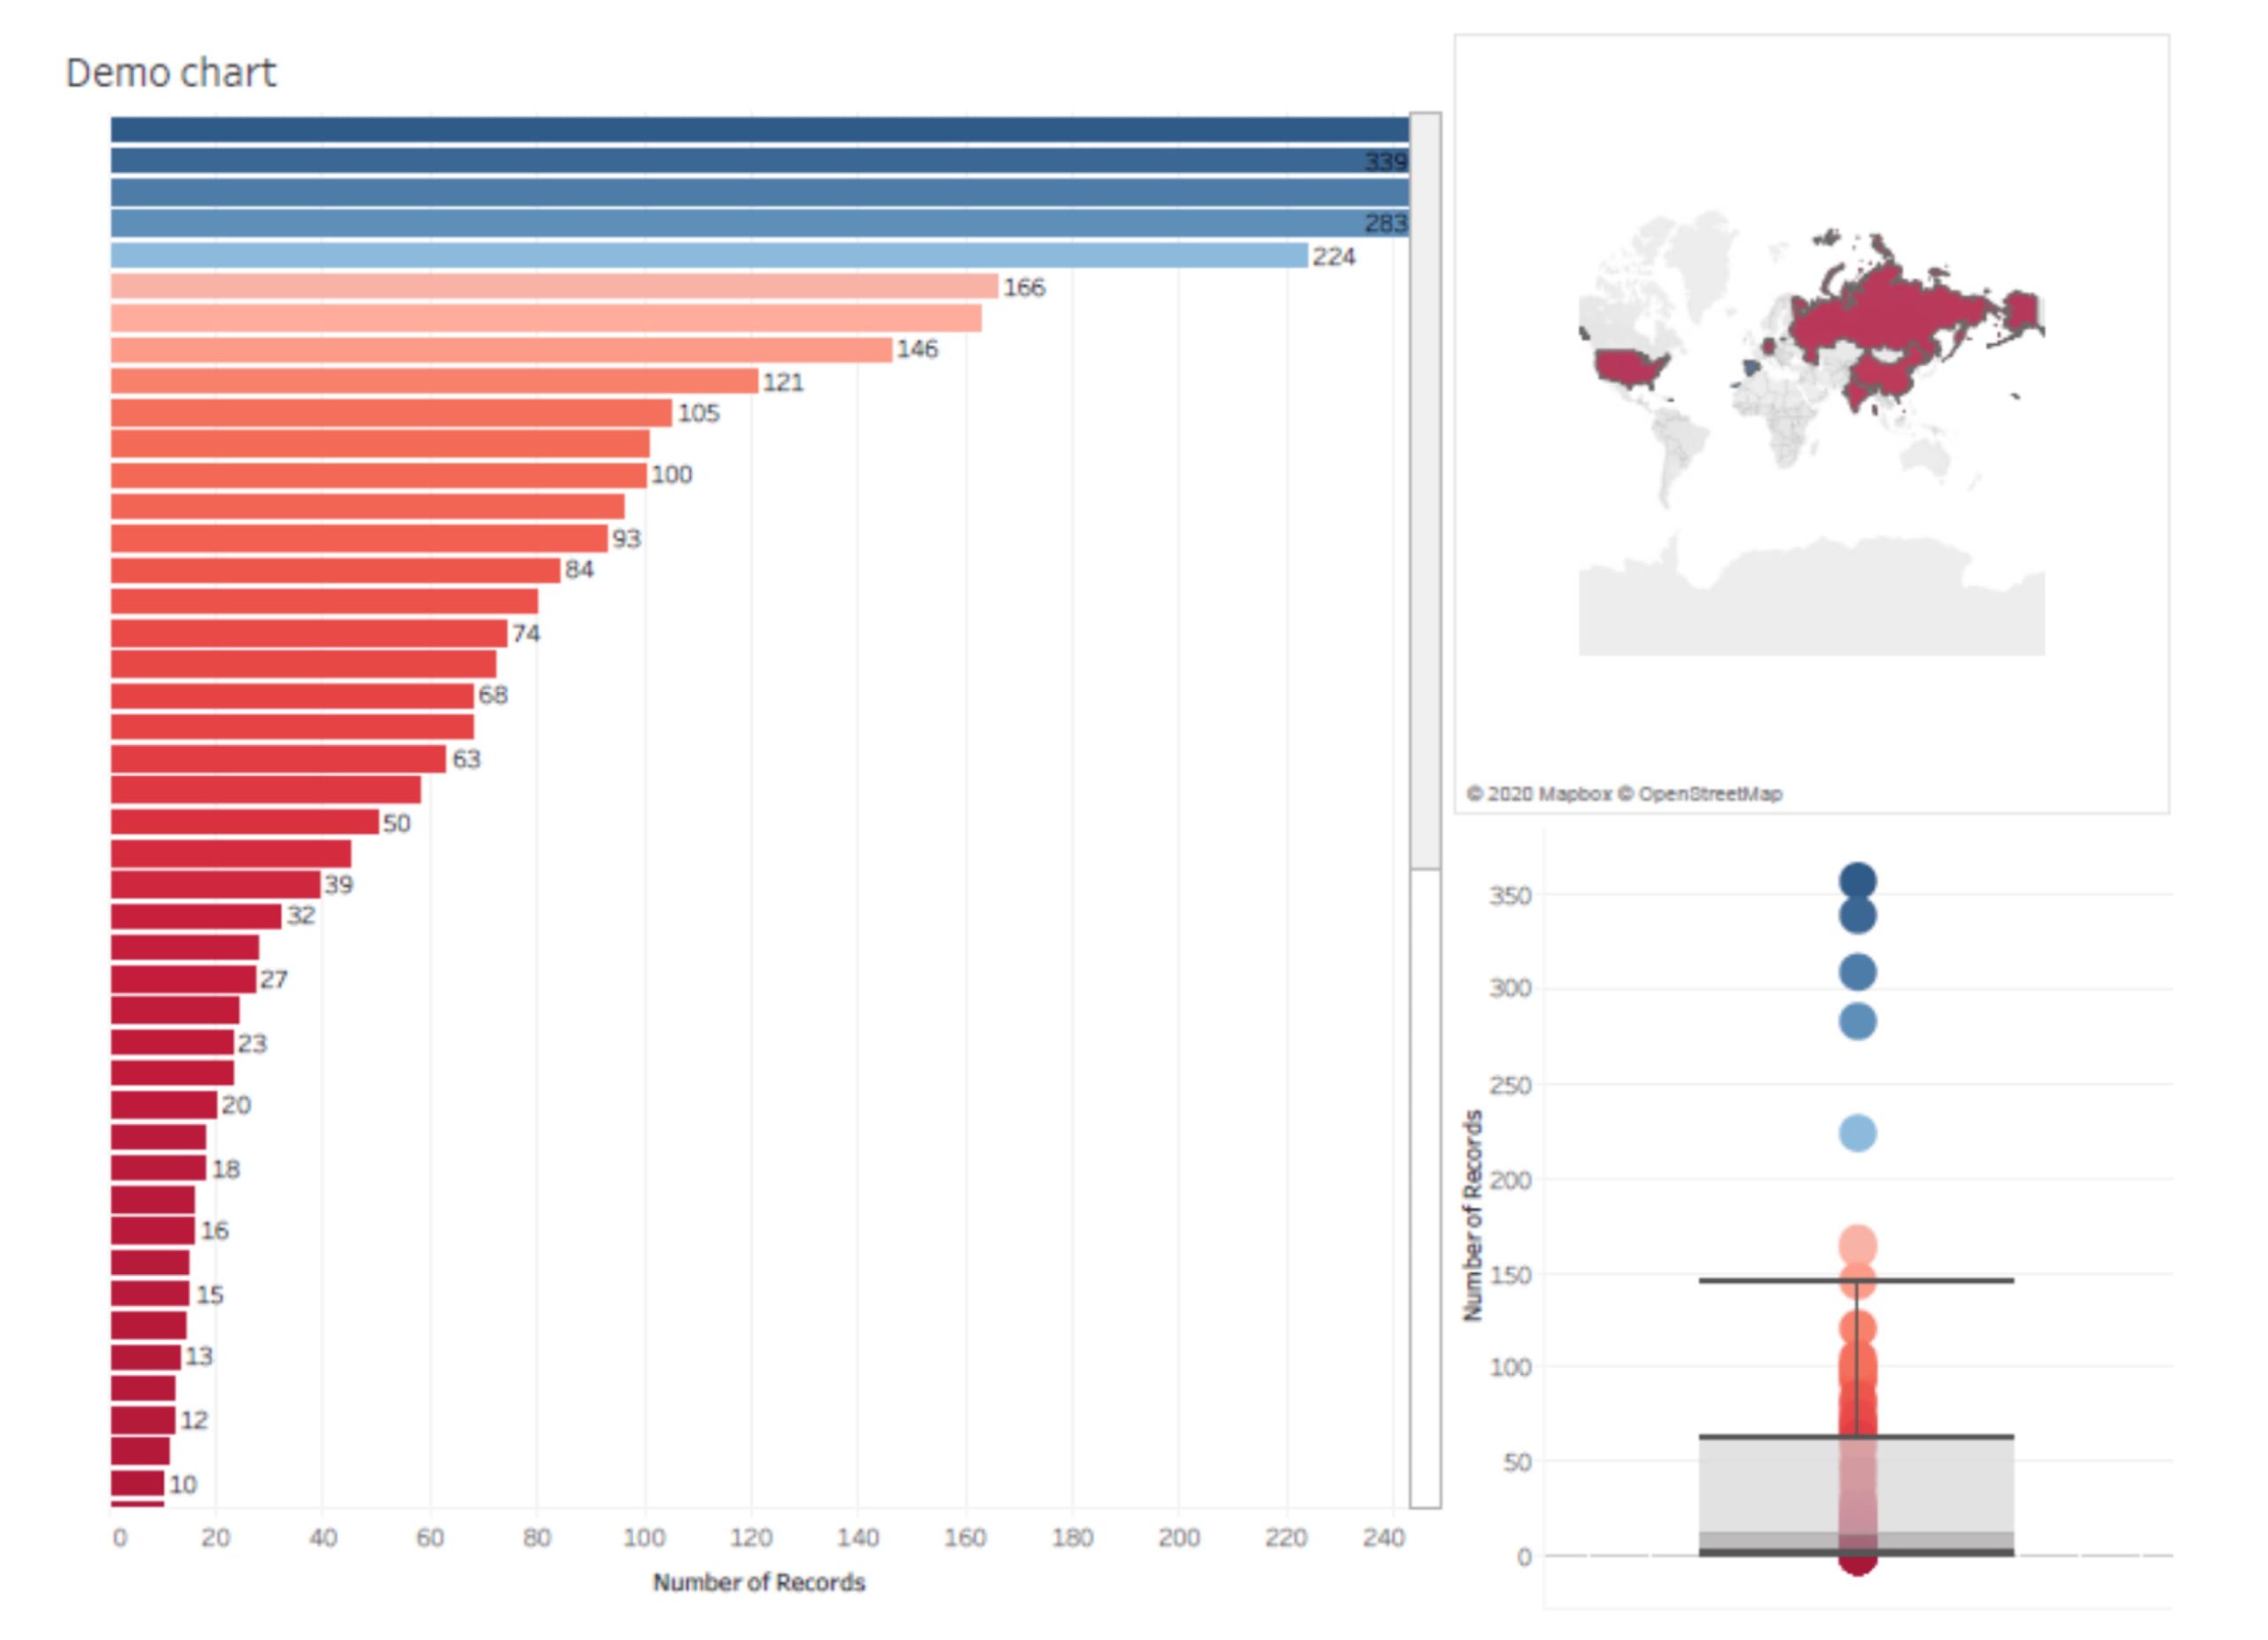
About 100 stakeholders were interviewed during the project, analyzed 3783 unique reports, analyzed over 1515 unique instances of KPIs in the collected reports. The Reports share 17 Technologies, 38 Data Sources, 75 Report Owners, 36 End-User types.
Using the visualization tool allowed to identify problems, analyze the collected data from all sides, prepare recommendations for the client.
Our team develops fully customizable extensions to suit any style instructions of the customer. Since standard BI tools have a limited set of designs, we can solve this problem by developing an internal custom dashboard.
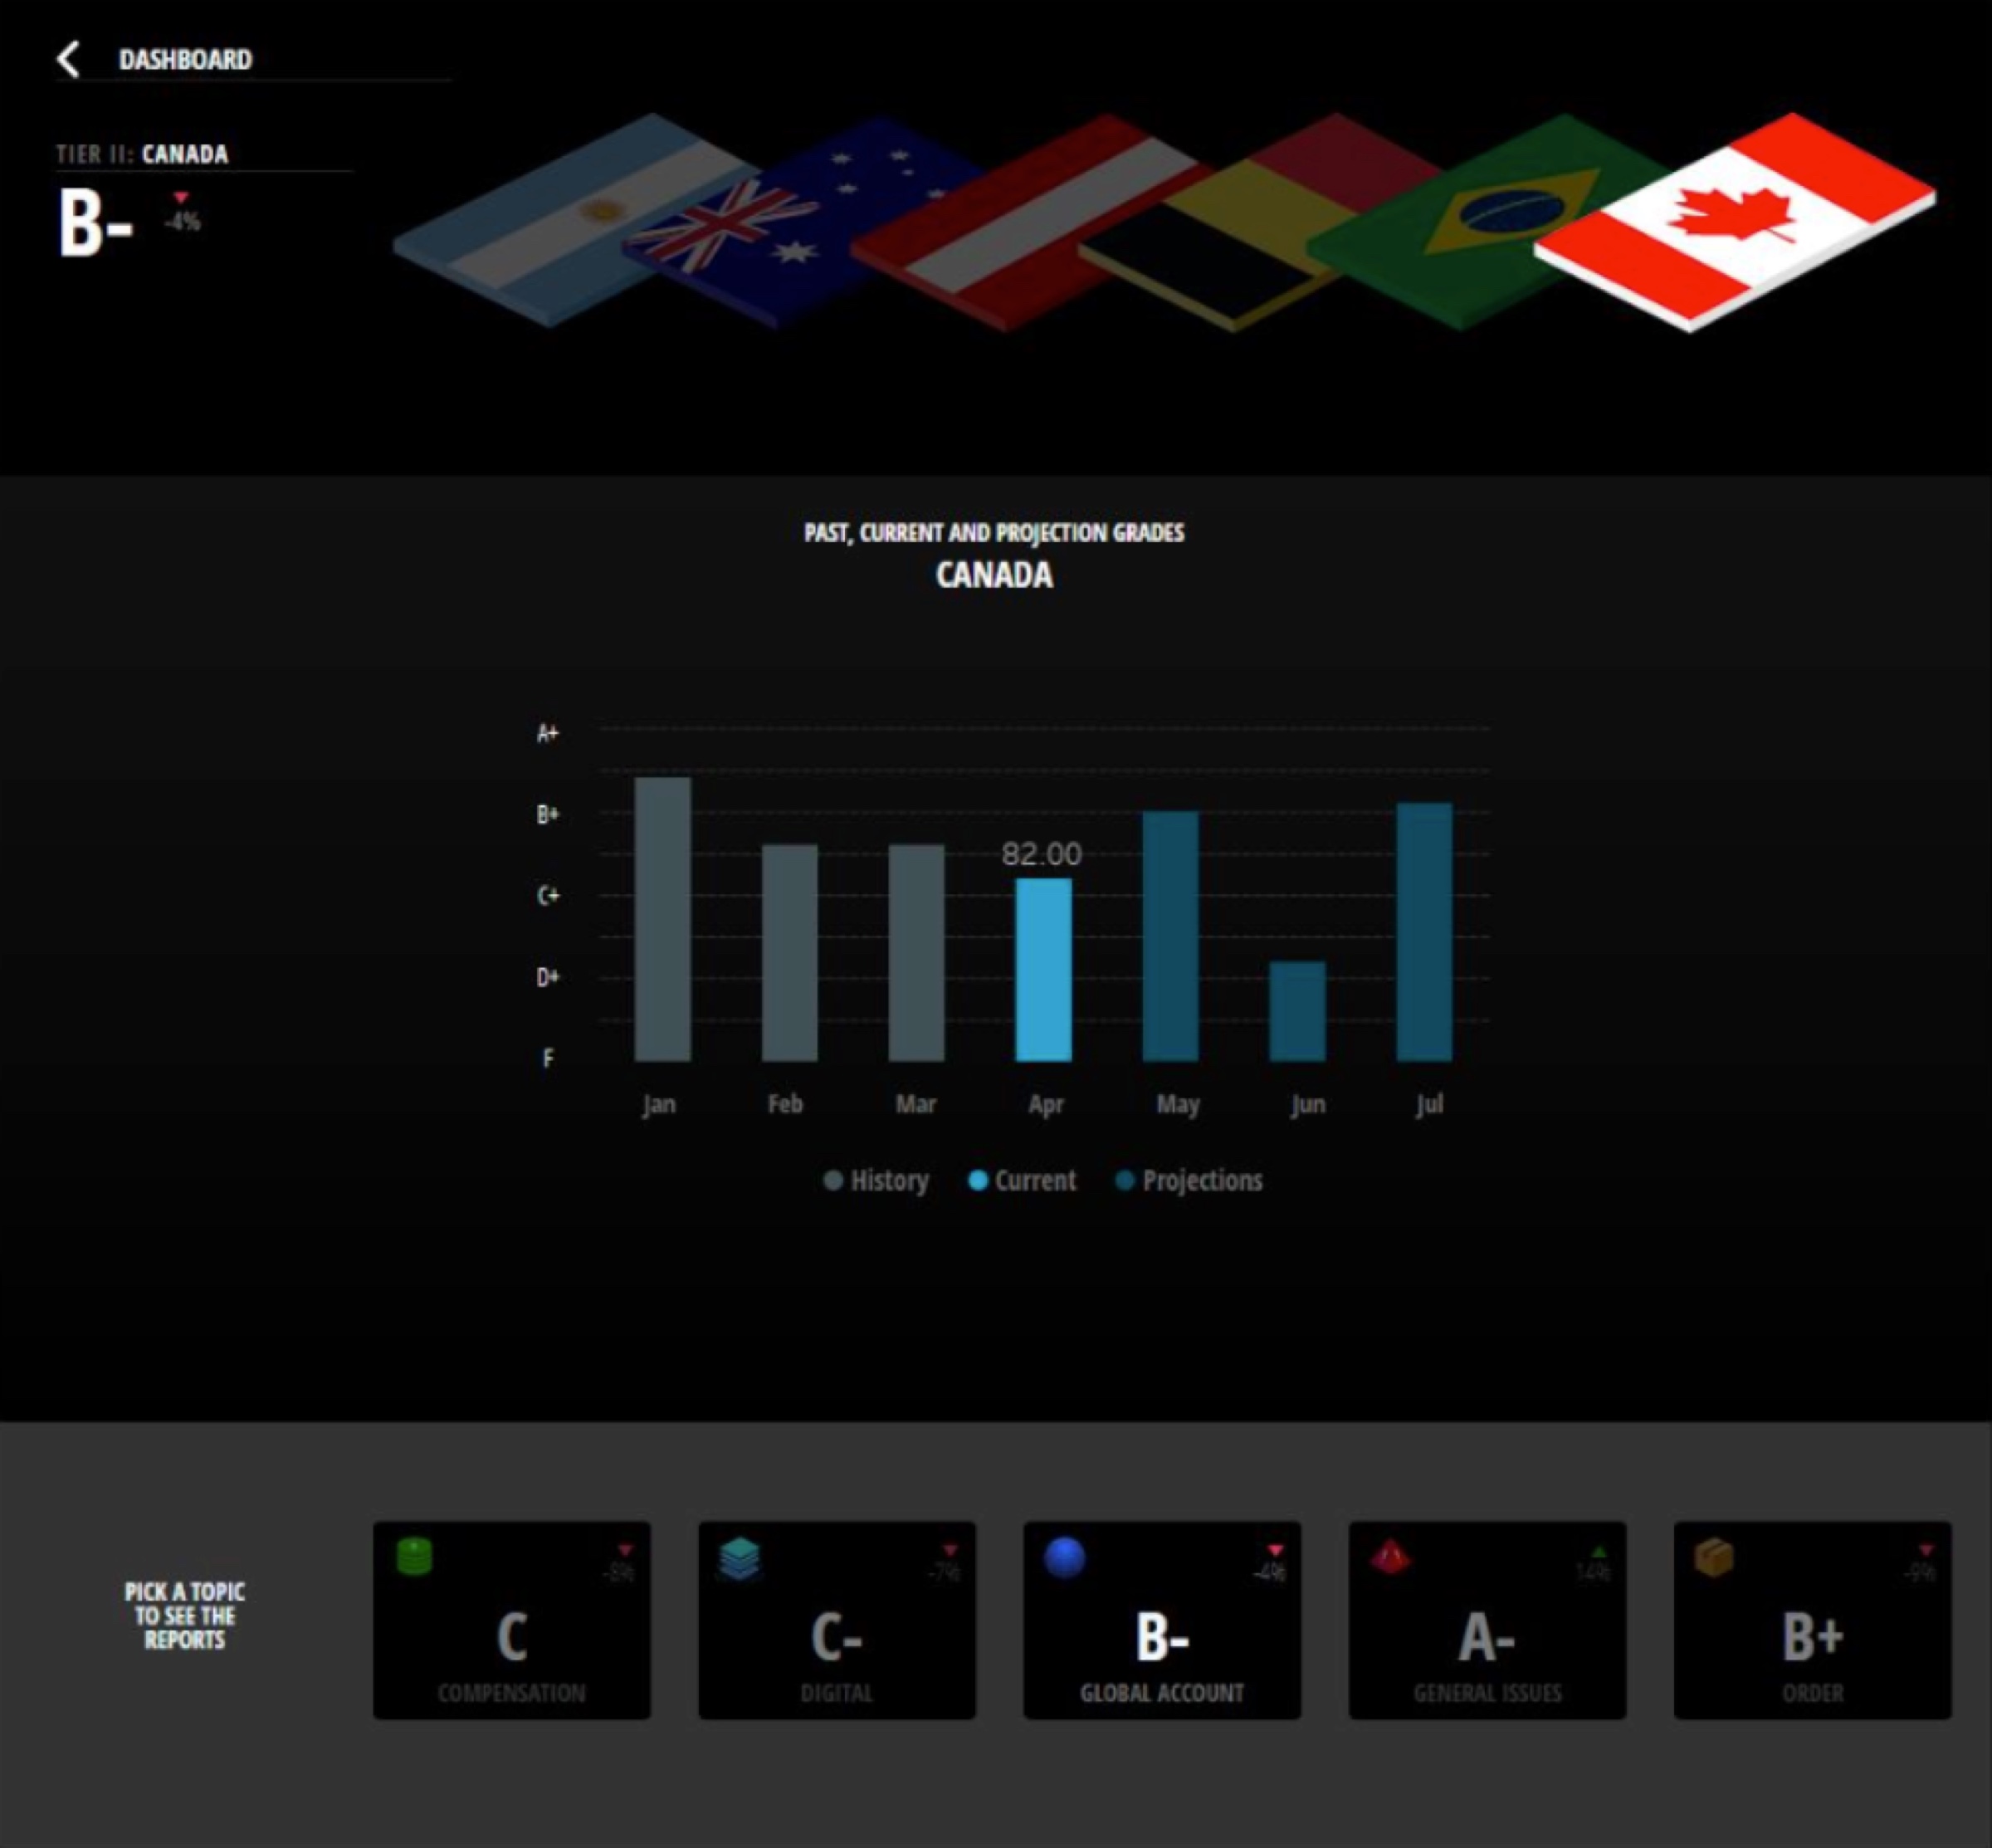
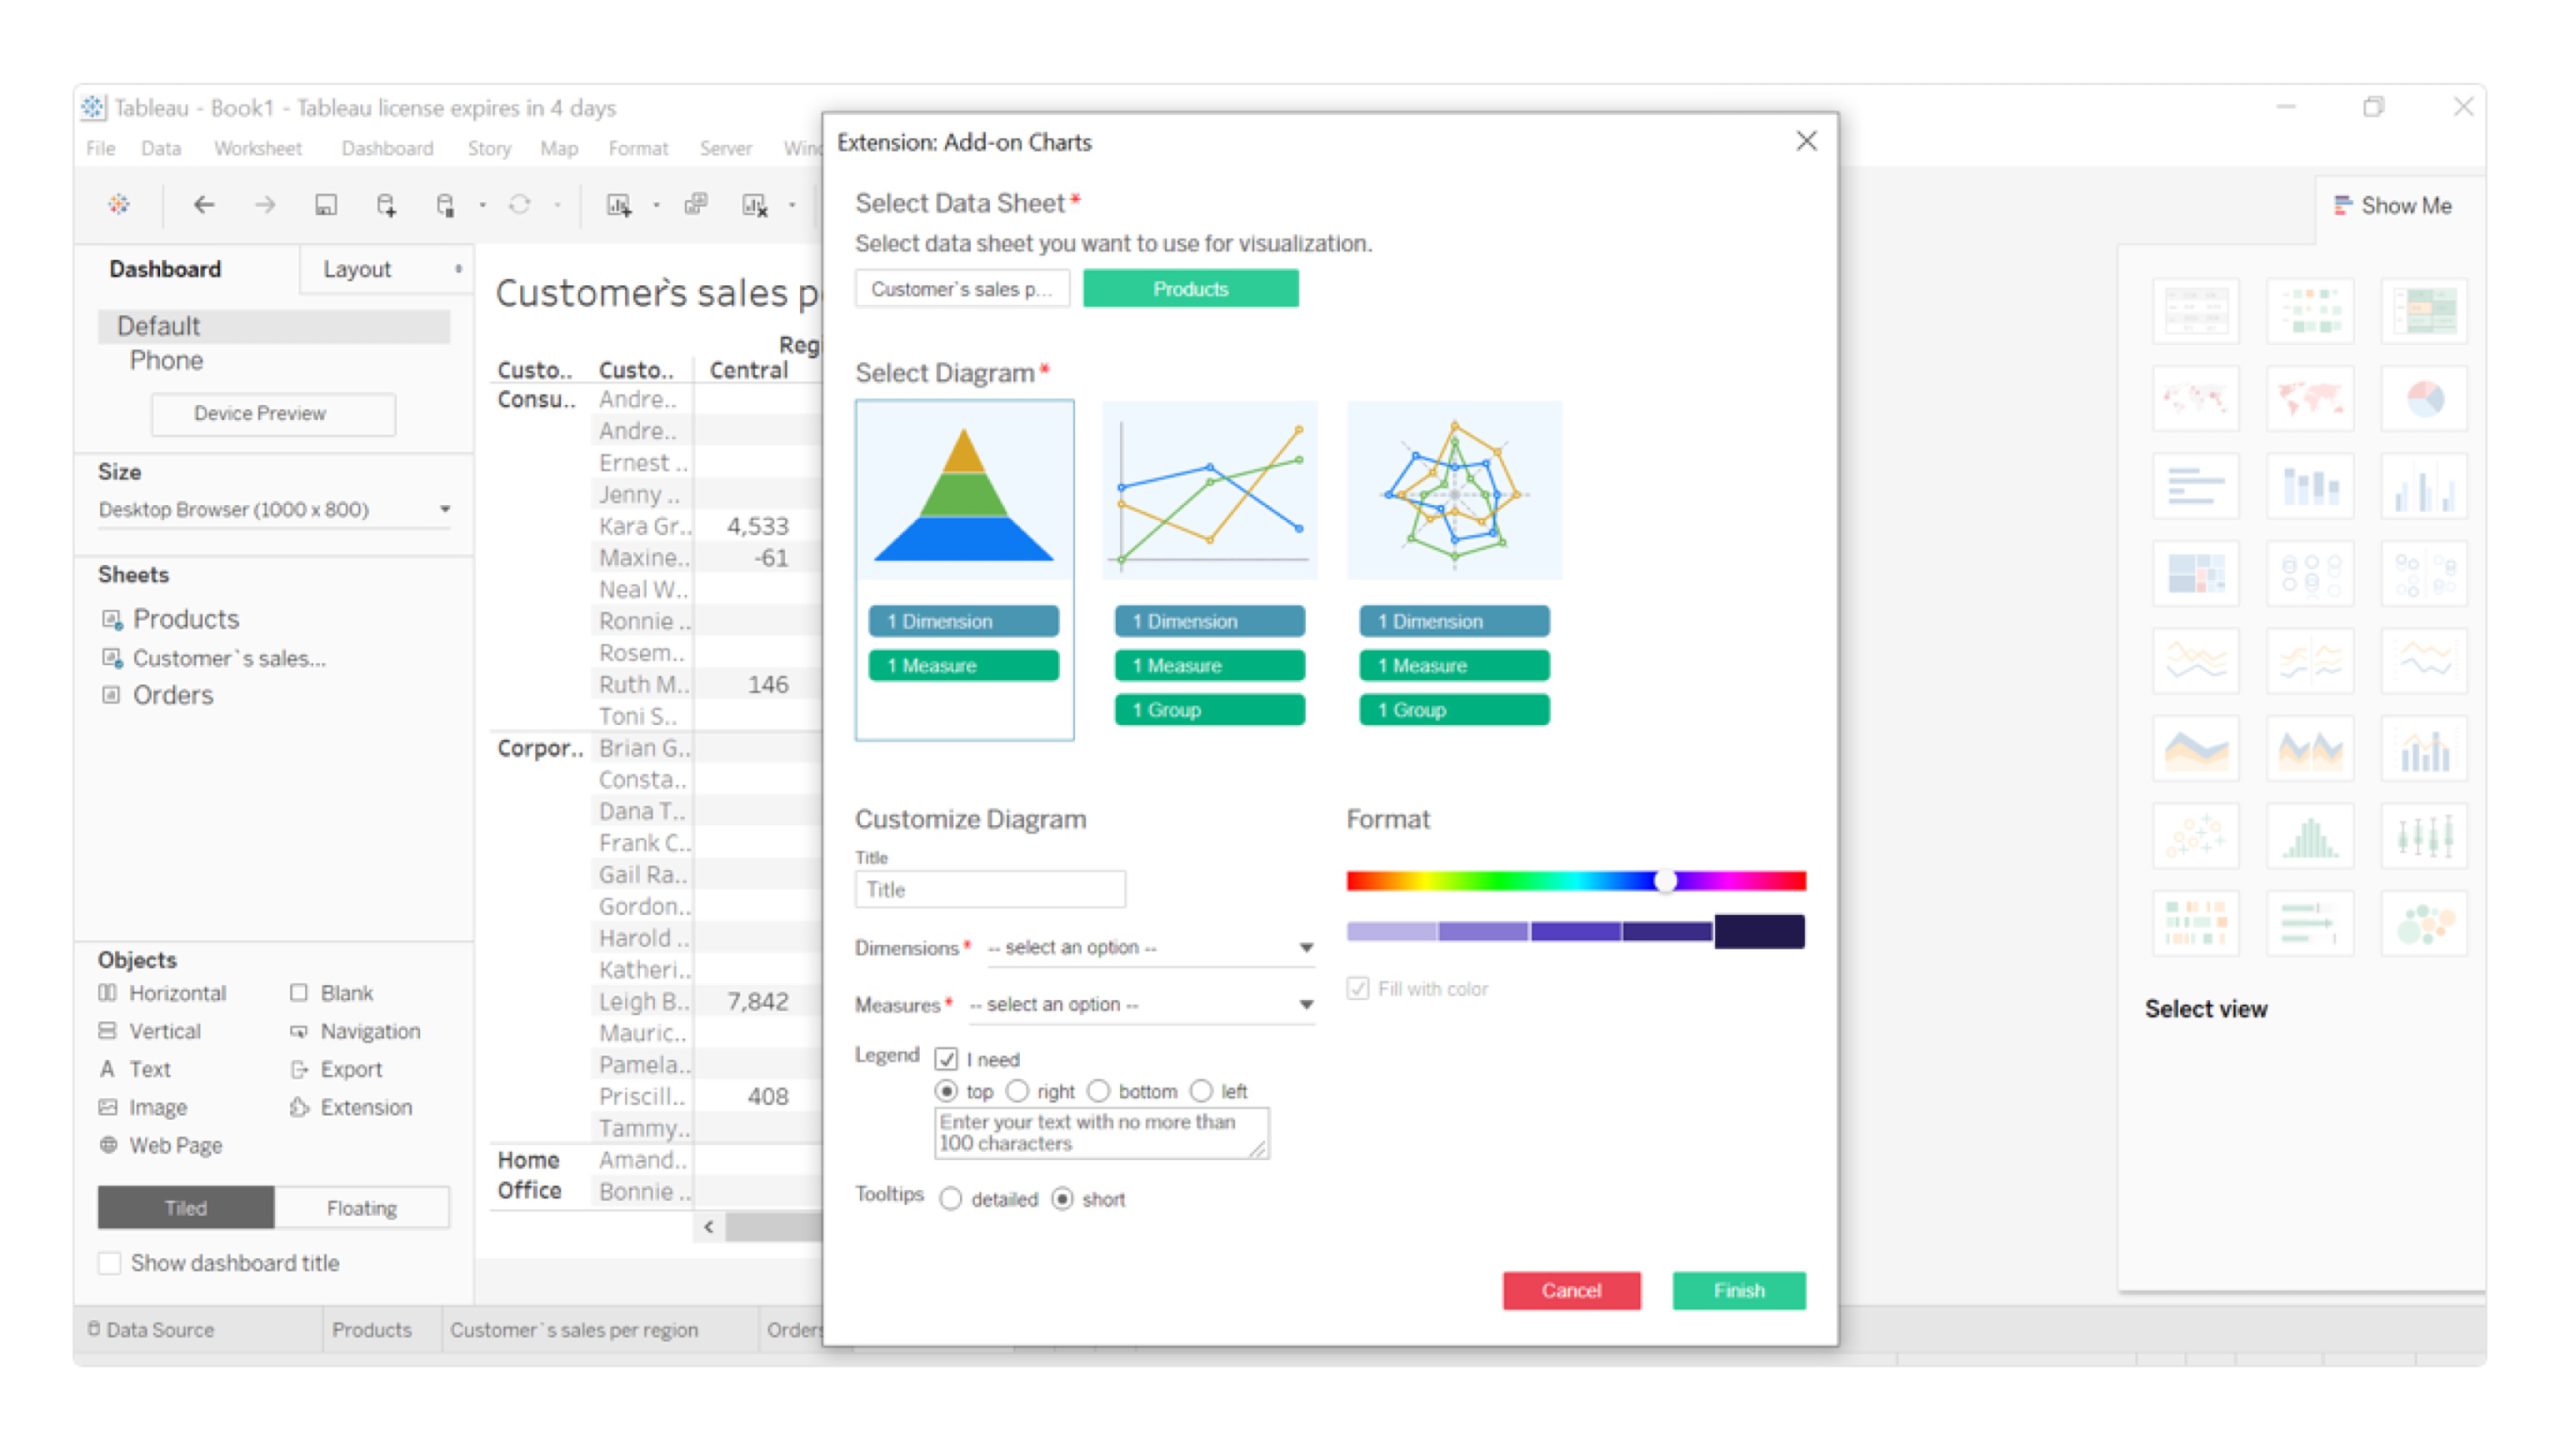
Tableau extension ‘Add-on Charts’ allows you to add additional charts to your dashboard that are not displayed on the standard Tableau “Show me” section.
Graphs and charts help to draw the attention. Add them to your toolbar and get a deep, fact-based visualization. A graphical display of information helps to get out a necessary message, support the conclusion or emphasize the focus.

This site is protected by reCAPTCHA and the Google Privacy Policy and Terms of Service apply.